7.5. Multi-Zone Part 3: Energy Simulation and Visualization of Results#
7.5.1. Generate Peak Heating and Cooling Plots for Multiple-Zones#
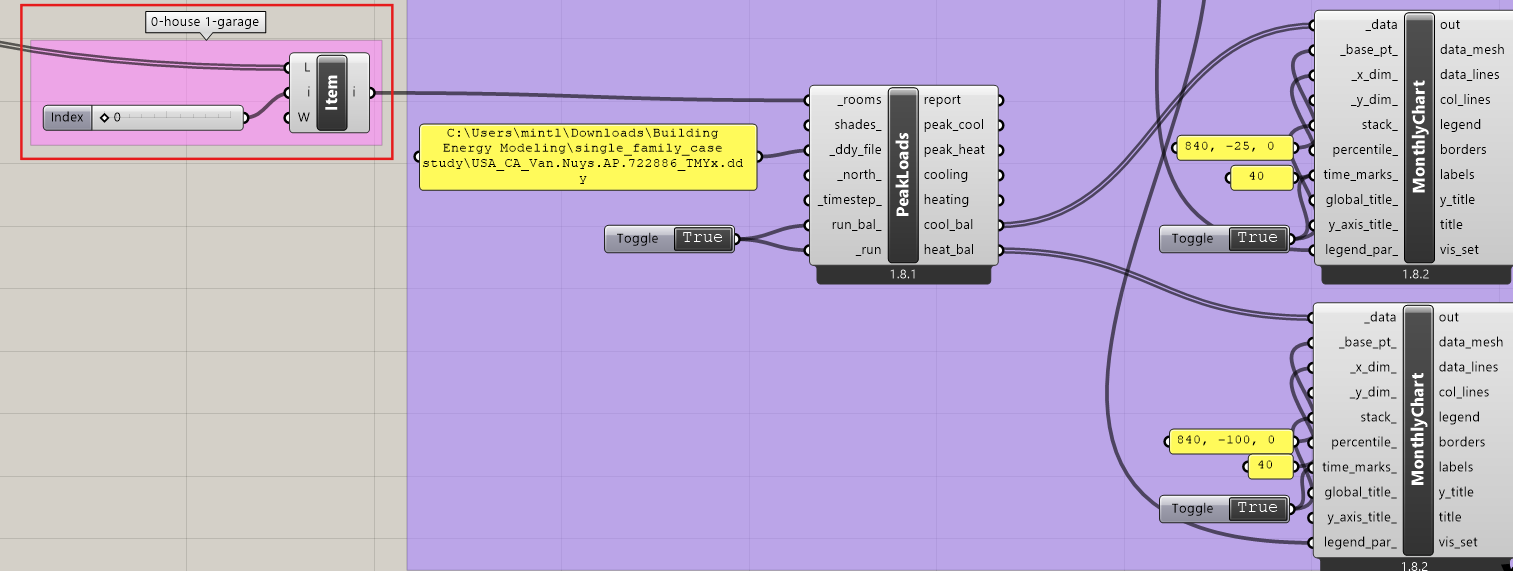
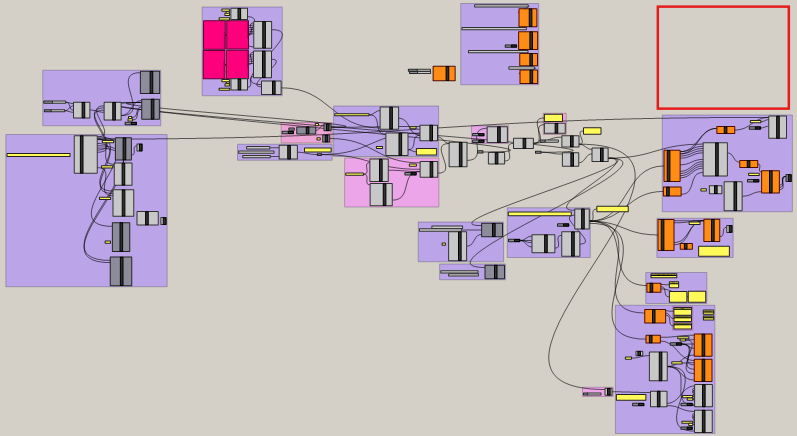
Reference this section of the Grasshopper.
Add a List Item and Slider to choose to view between generating a house peak plot or a garage peak plot. Connect the hb_objs from Border Shades to the L input of the List Item component.
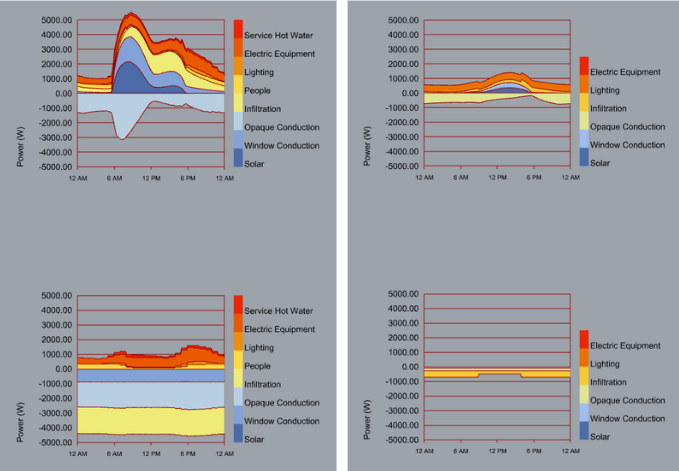
These should be the results. On the left is house, on the right is garage.
7.5.2. Alternative Method: Evaluating Peak Loads Per Zone#
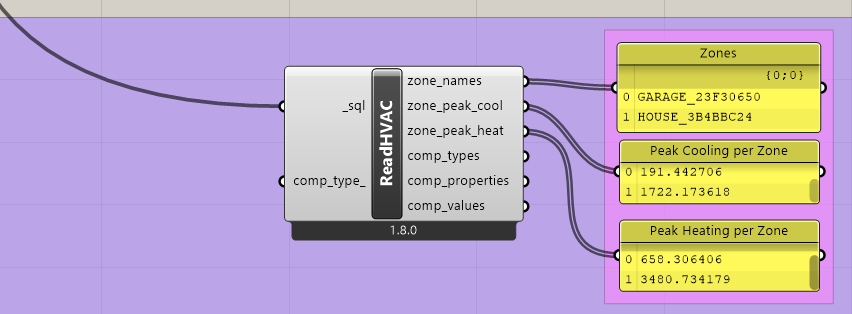
Use HB Read HVAC Sizing (ReadHVAC) to evaluate the peak loads per zone. Connect a panel to the zone_names to see how the values appear on the panels connected to zone_peak_cool and zone_peak_heat.
7.5.3. Generate 8760 Plot and Monthly Loads Plot for Multi-Zones#
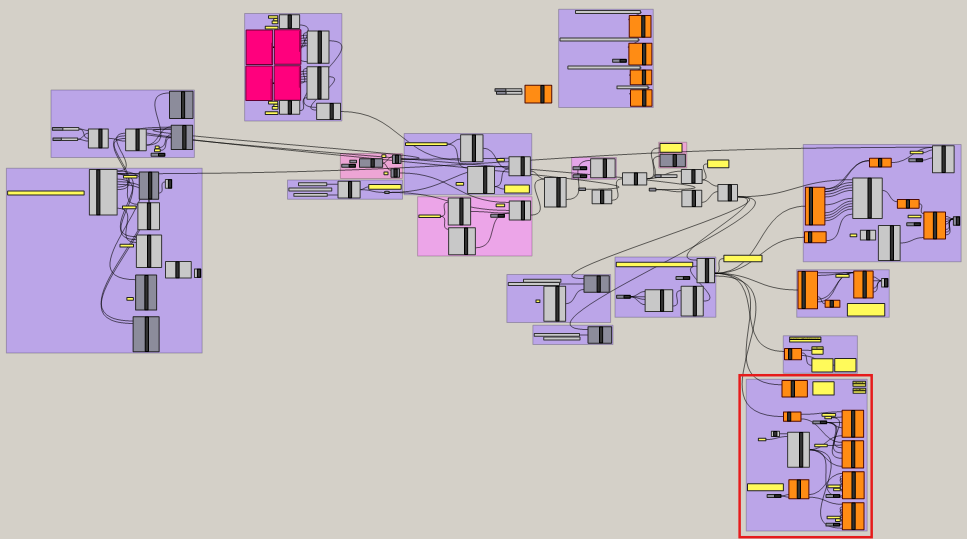
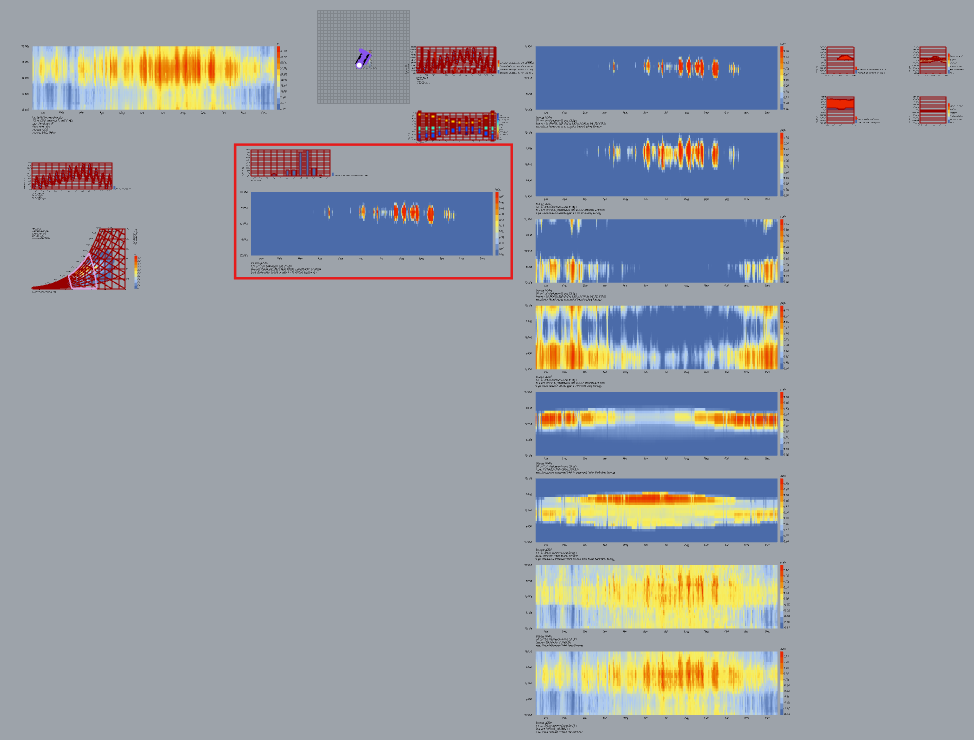
Use this area.
Recreate these components (HB Color Rooms) and connections below. For the Number slider, change to integer-type and set range from 0 to 1, referring to the two zones: house and garage.
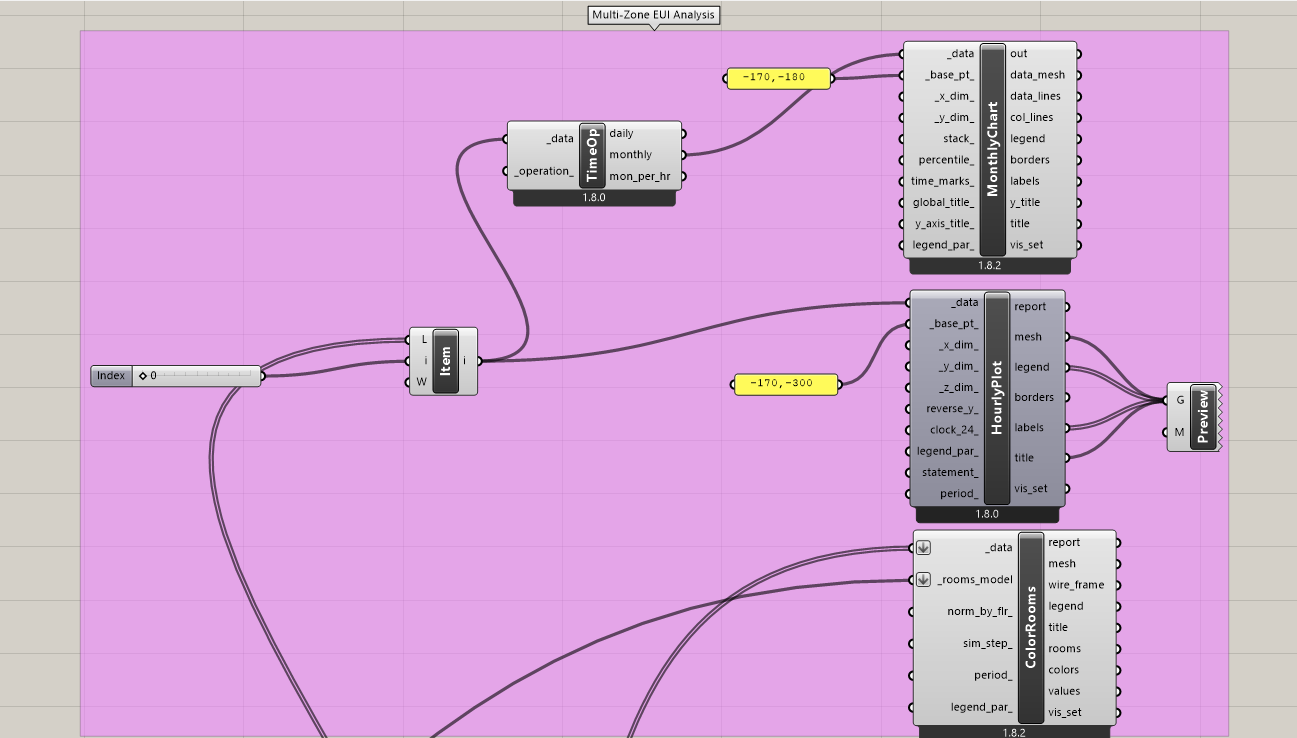
Connections to L input of List Item component and _data of HB Color Rooms (ColorRooms) are to the cooling output of HB Read Room Energy Results. The _rooms_model input of HB Color Rooms is connected to model output of HB Model.
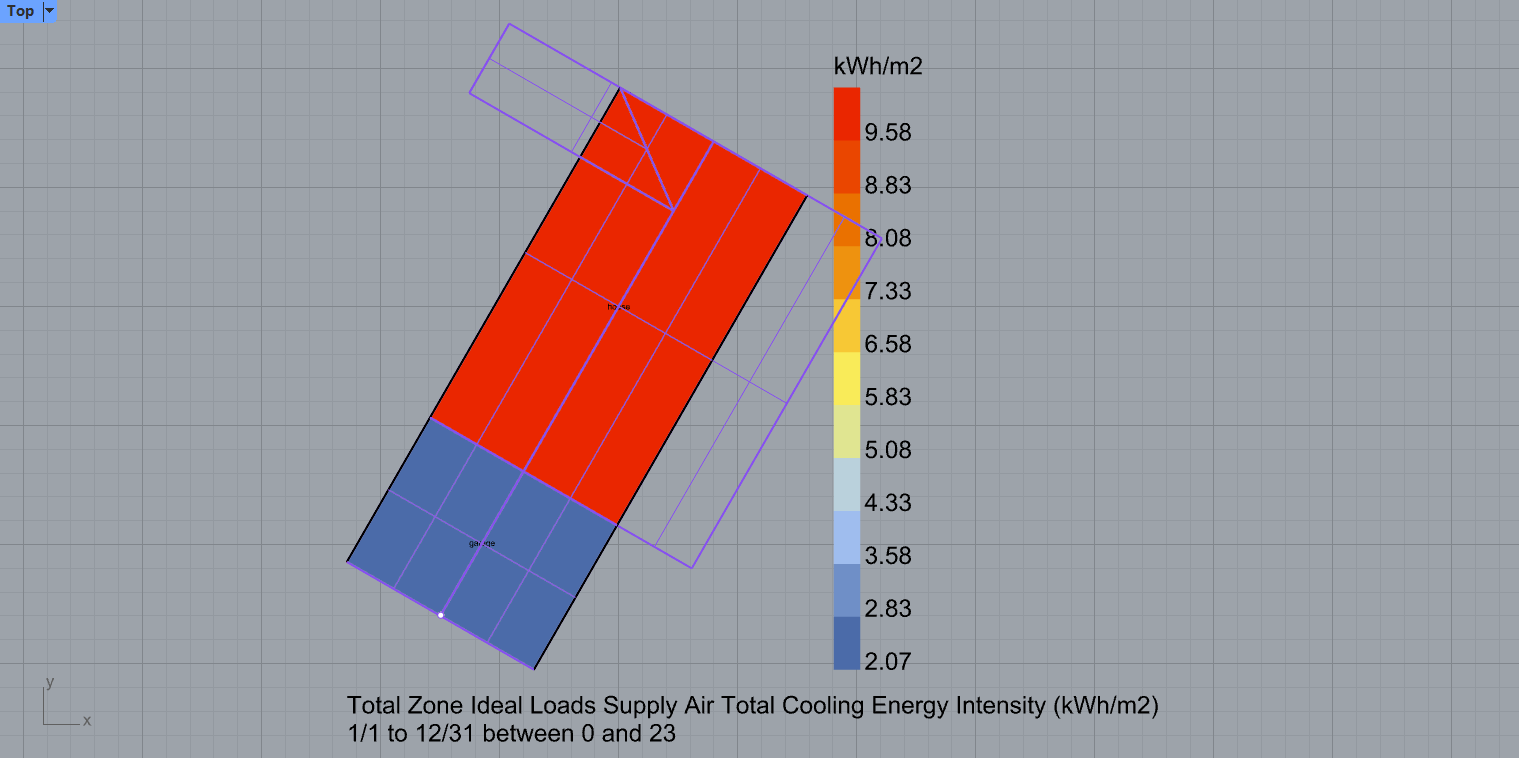
7.5.4. Visualization of Results#
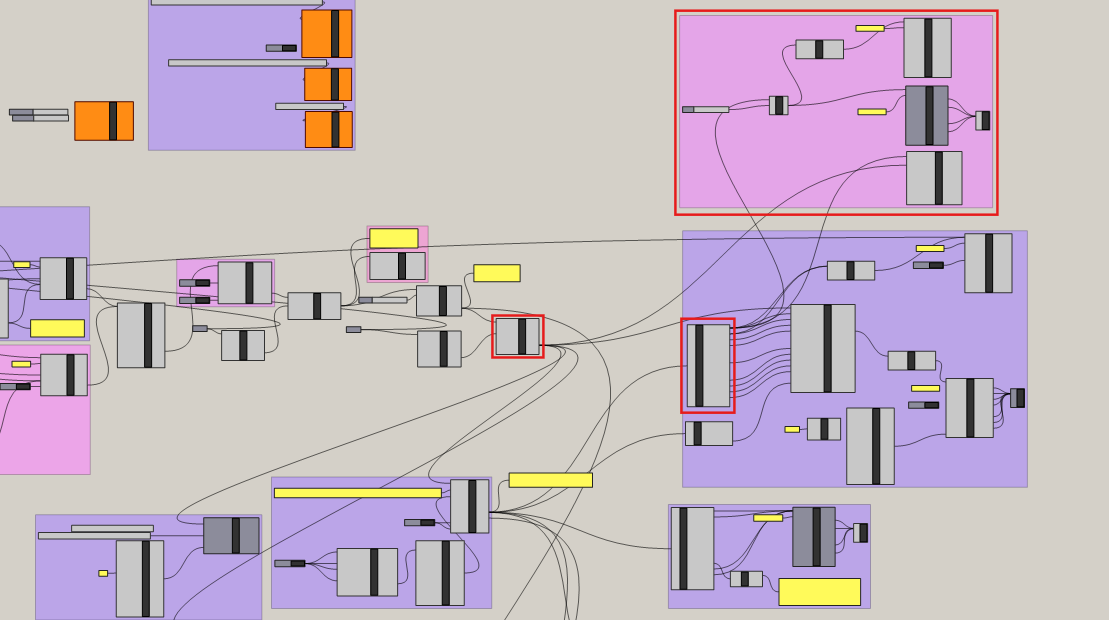
Reference location of the generated plots.
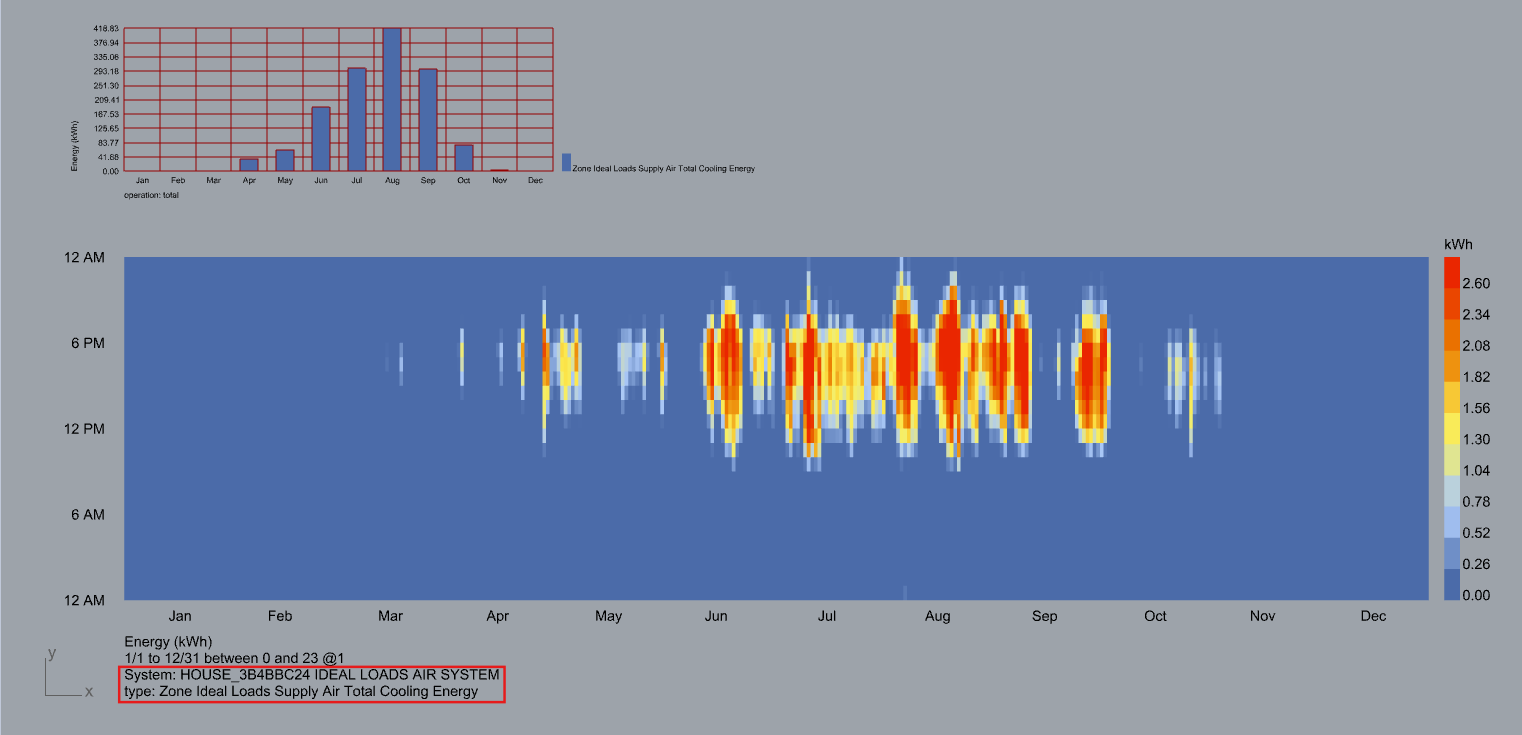
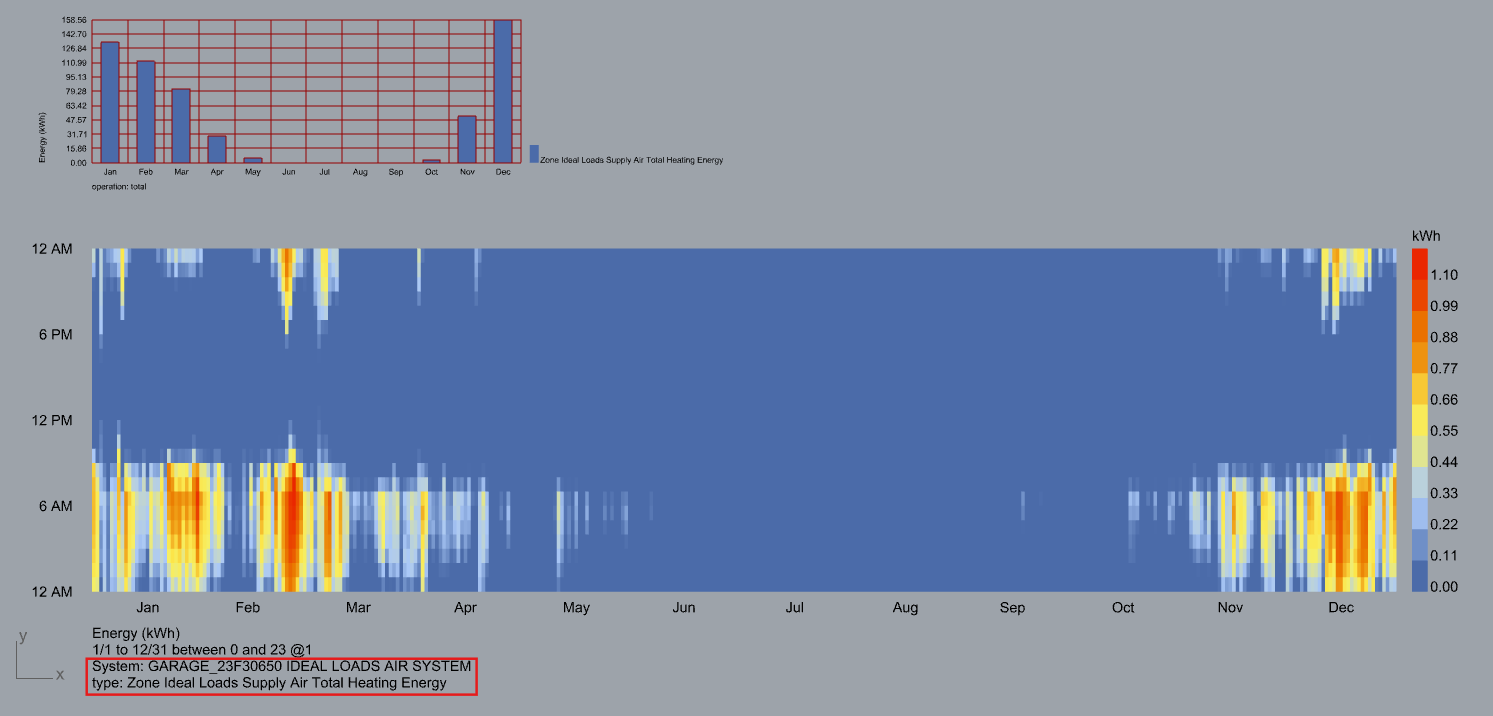
Peek the bottom of the 8760 Plot. It provides information about what the contents of the plot are comprised of. Since our data was connected to cooling, the type indicates it contains Zone Ideal Loads Supply Air Total Cooling Energy. The System tells us which zone we are looking at, in this case, the house.
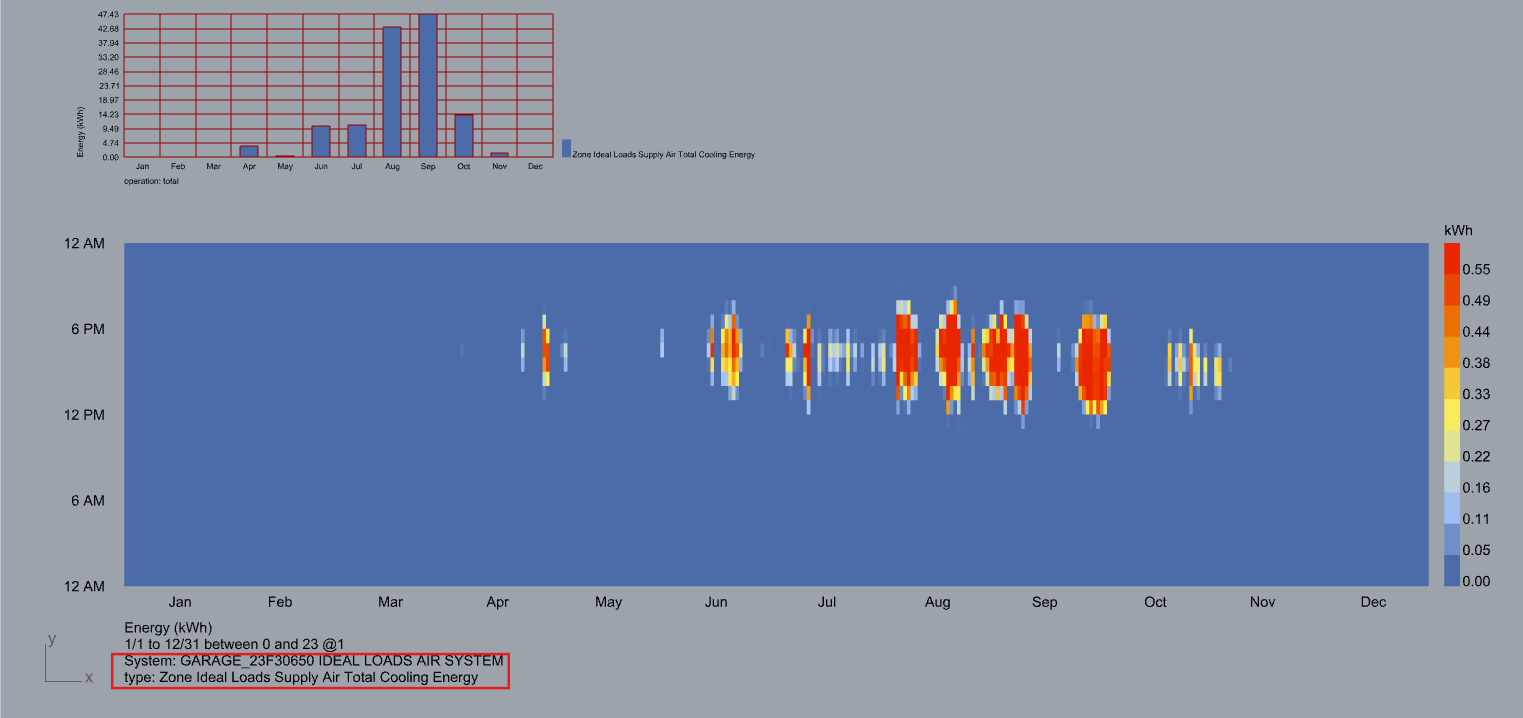
Move the slider to switch to the other zone and watch the 8760 plot change. Check the details of type and System again.
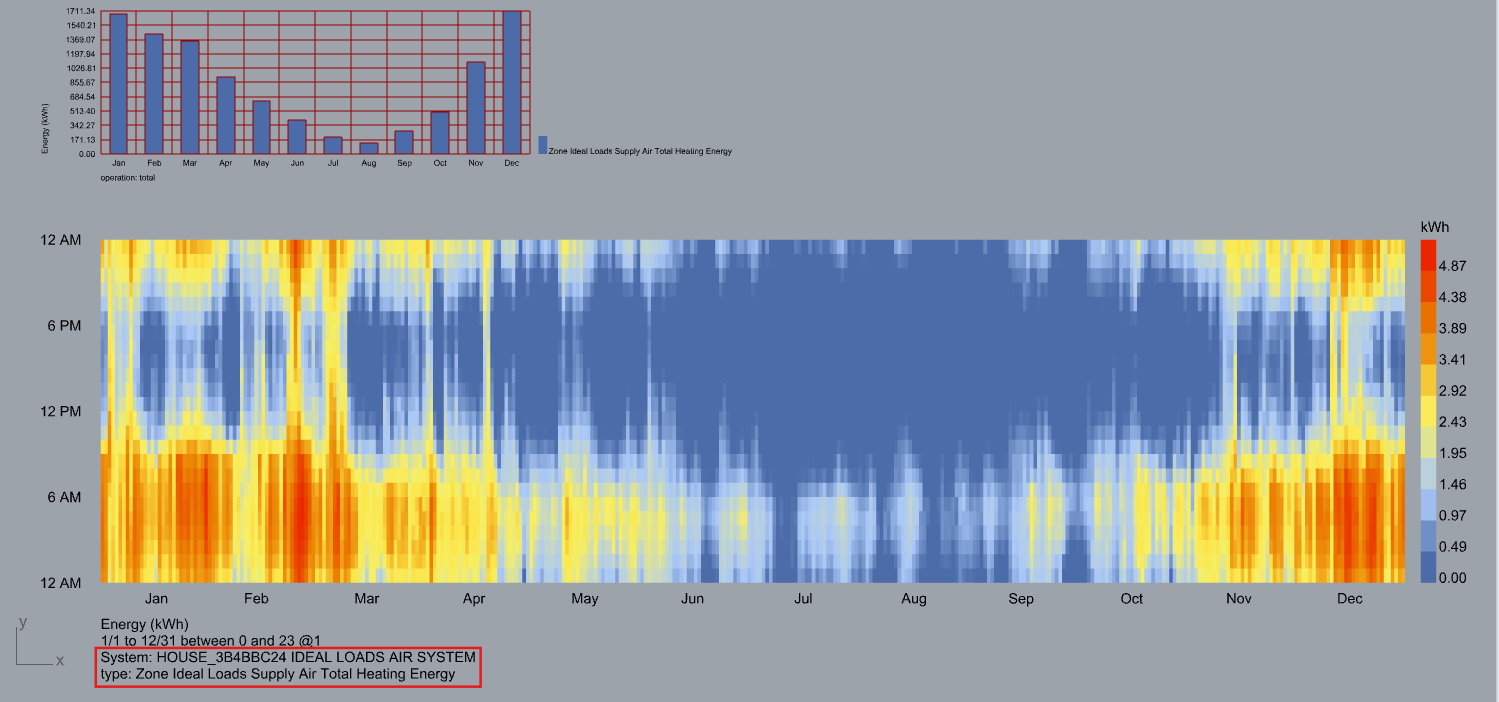
Disconnect the cooling output from List Item and HB Color Rooms. Try visualizing heating for the house and garage zones.
View the Rhino Model from Top View. Notice how the zones for the house and garage are colored. The HB Color Rooms (ColorRooms) component breaks down the total EUI per Zone/Room.